
 7 min read
The same metropolitan allure that once attracted starry-eyed workers to Manhattan, in spite of the high cost of living, is now the force leading some to abandon it. In the age of COVID-19, the perks of a skyline view and easy commute (not to mention the convenience of coming home after late night happy hours) pales in comparison to the potential danger posed by sharing spaces with dozens of strangers. In addition, most white-collar workers have been working from home (WFH) since March 2020, eliminating the need to commute. This has led many real estate investors to ask, will residents flee New York City altogether?
Our data will demonstrate that, while some residents are leaving the city during the pandemic, many families are still staying within commuting distance, demonstrated by a resurgence of interest in homes in the suburban areas just outside New York City. Our analysis of residential real estate metrics during the pandemic suggests that, instead of leaving New York altogether, families are ditching the city for the suburbs.
At Unison, we are most interested in the housing market implications of demographic movements. “Rent downtown for fun, buy in the suburbs for family” had long been the standard American dream formula. With the pandemic rapidly changing housing needs, we sought to understand how markets have been impacted in 2020.
A recent New York Times article showed that Manhattan neighborhoods with the most resident departures in the wake of the COVID-19 crisis are generally richer, whiter, and had residents who were more likely to walk or bike to work[1]. From this, we can infer that residents who departed had the financial security and work flexibility to choose where to live and whether they want to rent or buy their home.
Assuming most departed workers will be tele-commuting as long as the stay-at-home orders are in place, but still live within a commutable distance to their former offices, the exodus can be categorized into three main groups:
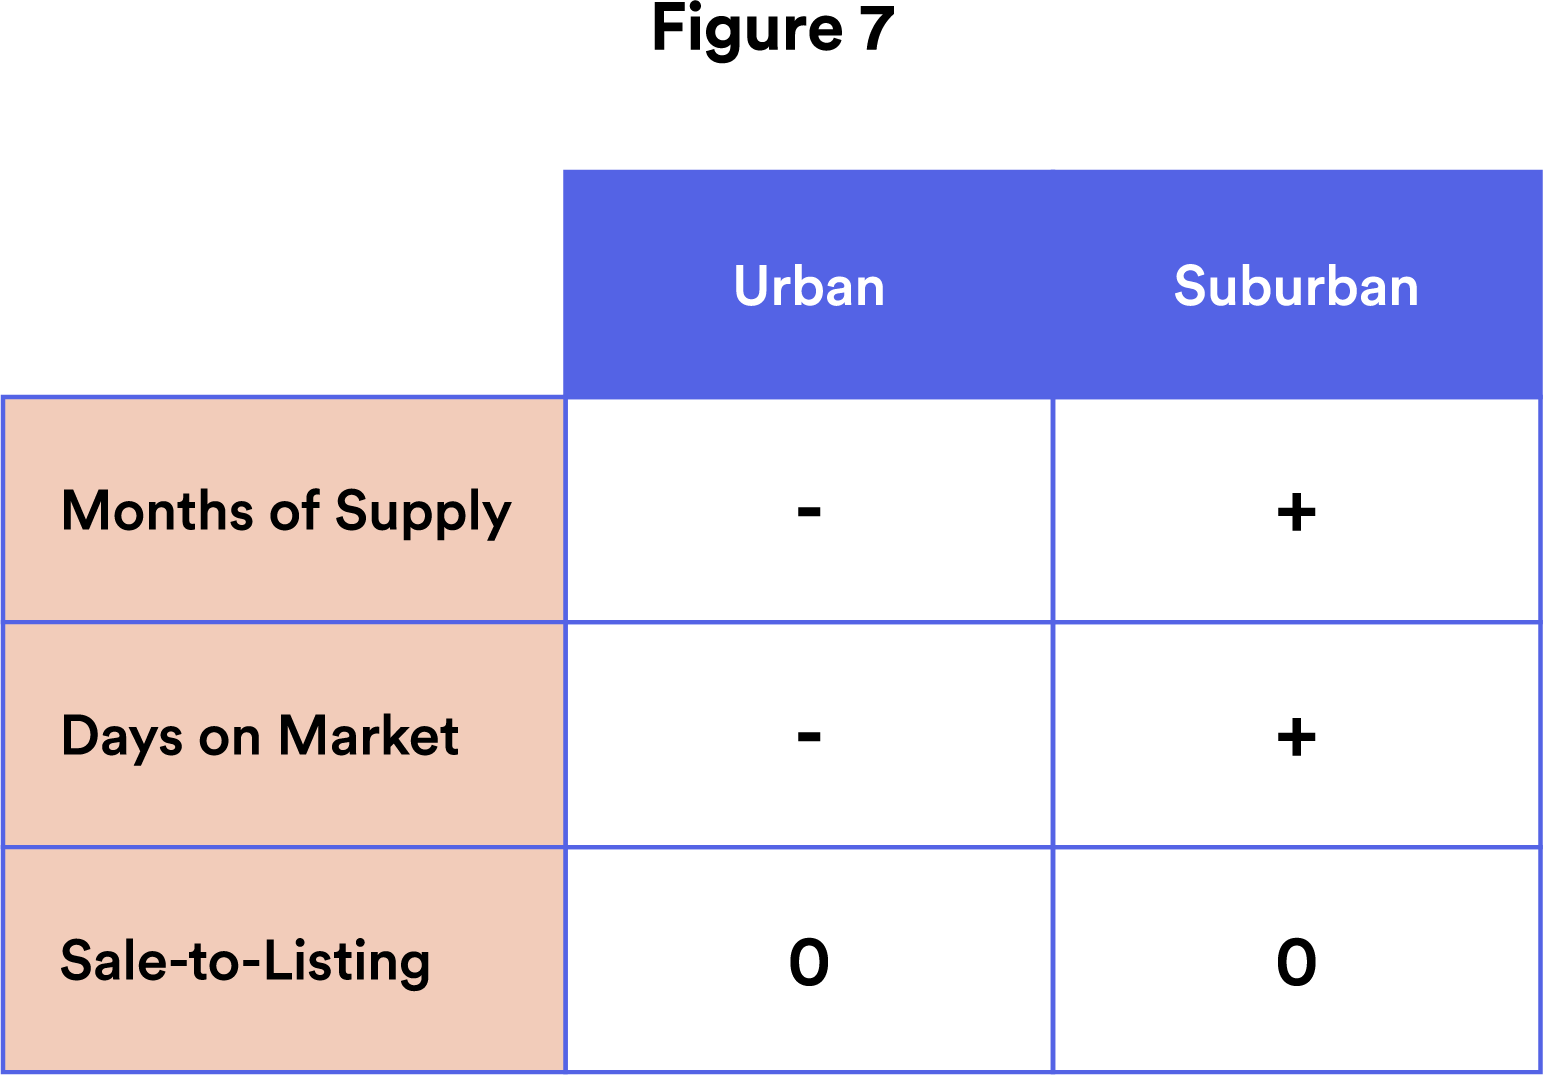
If suburbs are the next big thing, has the buying wave already begun? To find out, we divided counties within and surrounding New York City into urban and suburban markets as follows:
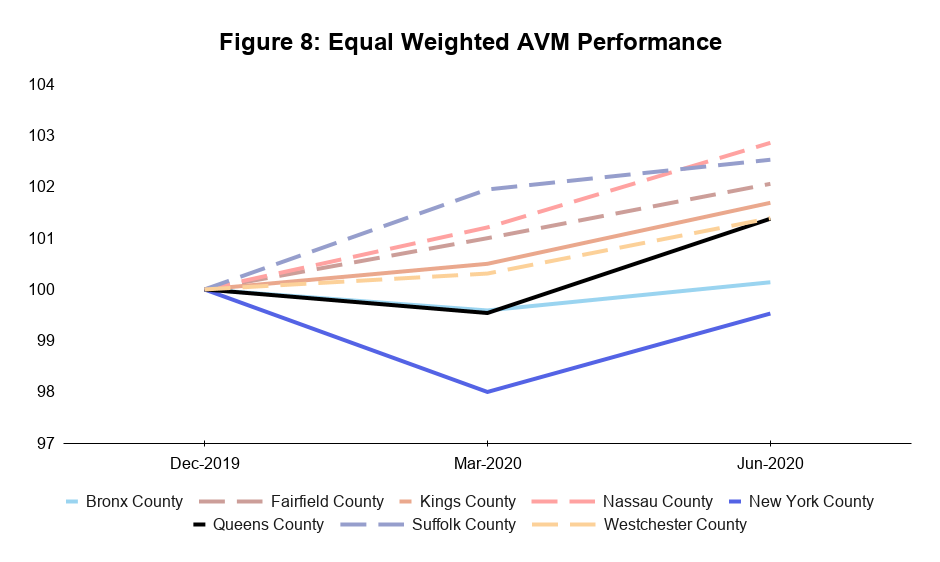
Urban: Bronx, New York County (Manhattan), Queens, Kings County (Brooklyn)
Suburban:: Nassau county (a portion of Long Island just west of Queens), Suffolk County (Hamptons), Fairfield County (Greenwich, CT), Westchester County (Scarsdale, Bronxville)
Using seasonally-adjusted data from Redfin, we were able to compare market performance trends between the two groups. The three metrics we believe best reflect the health of housing markets are Months of Supply, Days on Market, and Sale-to-Listing ratio. The data for these metrics are frequently-updated, well-understood, and used widely by real estate agents to assess market temperature.
Using seasonally-adjusted data from Redfin, we were able to compare market performance trends between the two groups. The three metrics we believe best reflect the health of housing markets are Months of Supply, Days on Market, and Sale-to-Listing ratio. The data for these metrics are frequently-updated, well-understood, and used widely by real estate agents to assess market temperature.
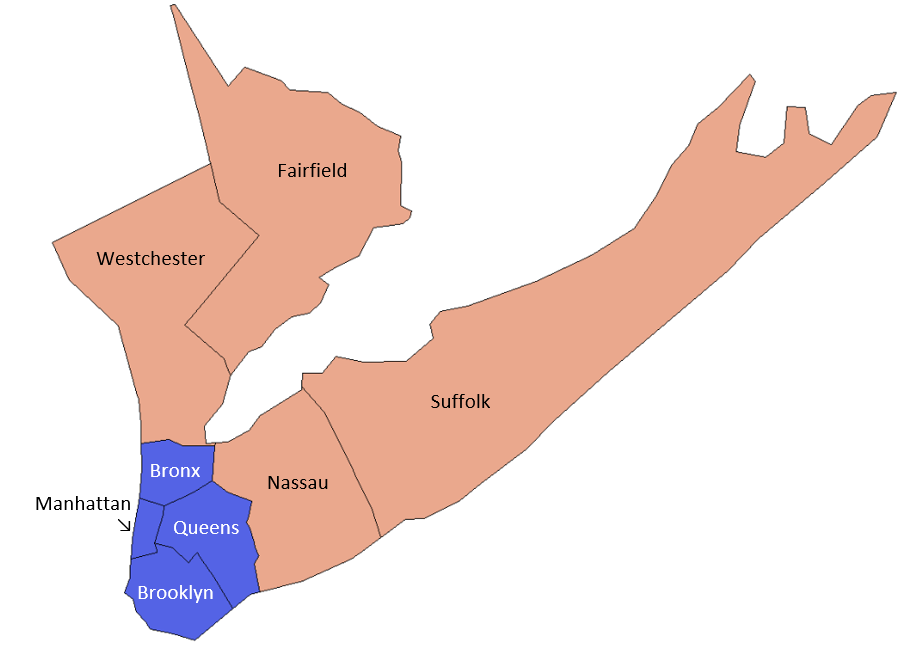
Months of Supply represents the number of active listings in the market divided by the number of monthly transactions. A higher number indicates an abundance of supply and/or low transaction volume. Since the introduction of the mansion tax hike in July 2019, Manhattan has seen its Months of Supply climb from 30 months in June 2019 to 88 months in February 2020 (Figure 1). Before COVID-19, transactions for high-end properties waned in the wake of the mansion tax, and mega-developments such as Hudson Yards were already exacerbating the oversupply. COVID-19 has worsened the supply glut to an astounding 271 months as of June 2020. This means that, at the current transaction pace, it would take 22 years to work through the available housing inventory, assuming no new listings are brought to the market. Other New York City boroughs have seen more modest upticks in supply since March 2020. The Bronx held steady at nine Months of Supply, Brooklyn increased from 12 to 20 months, and Queens climbed from seven to 14 months (Figure 2).
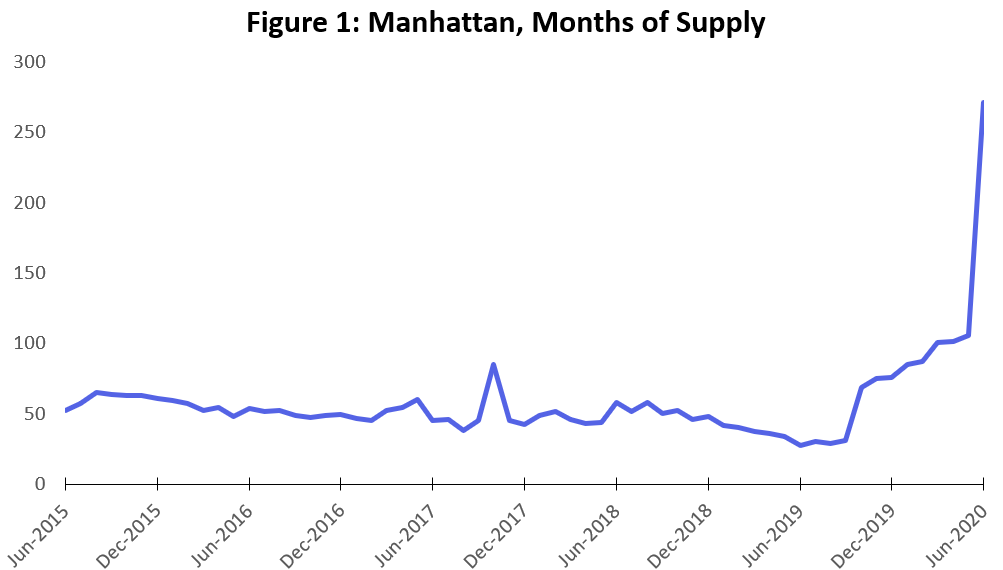
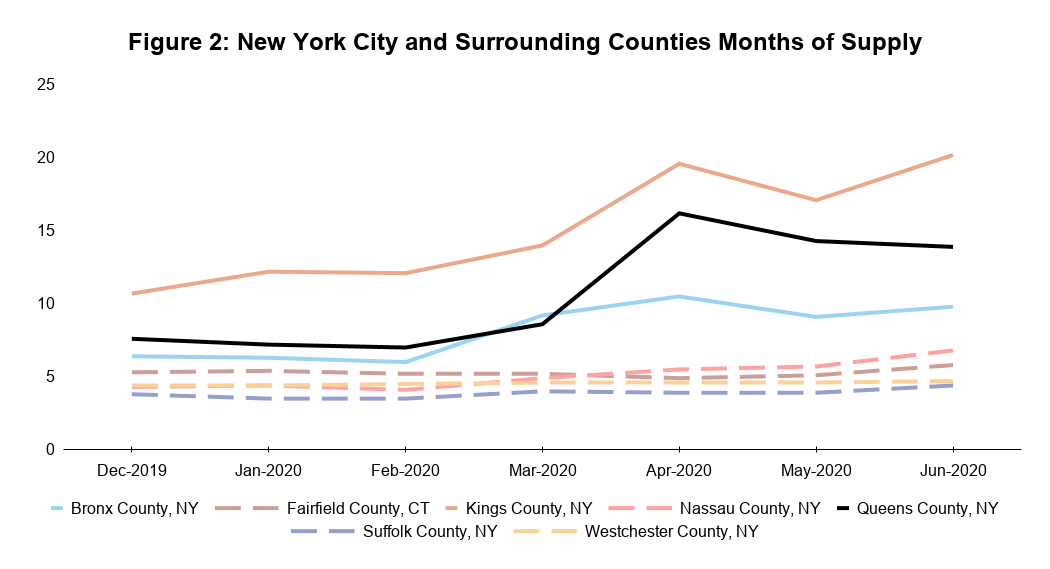
In contrast, the pandemic has had virtually no impact on Months of Supply in the suburbs. Supply at all four suburban counties held steady between four to six months. Figure 3 illustrates the percentage change in months supply, highlighting the divide between urban and suburban markets.
Days on Market (DOM) measures the total number of days since the property was first listed. This metric is most useful when evaluated for a specific market over time rather than across markets since typical DOM could vary drastically across markets. For example, it takes roughly two months to sell a house in Westchester, but Brooklyn sellers would be happy if they can sell in three.
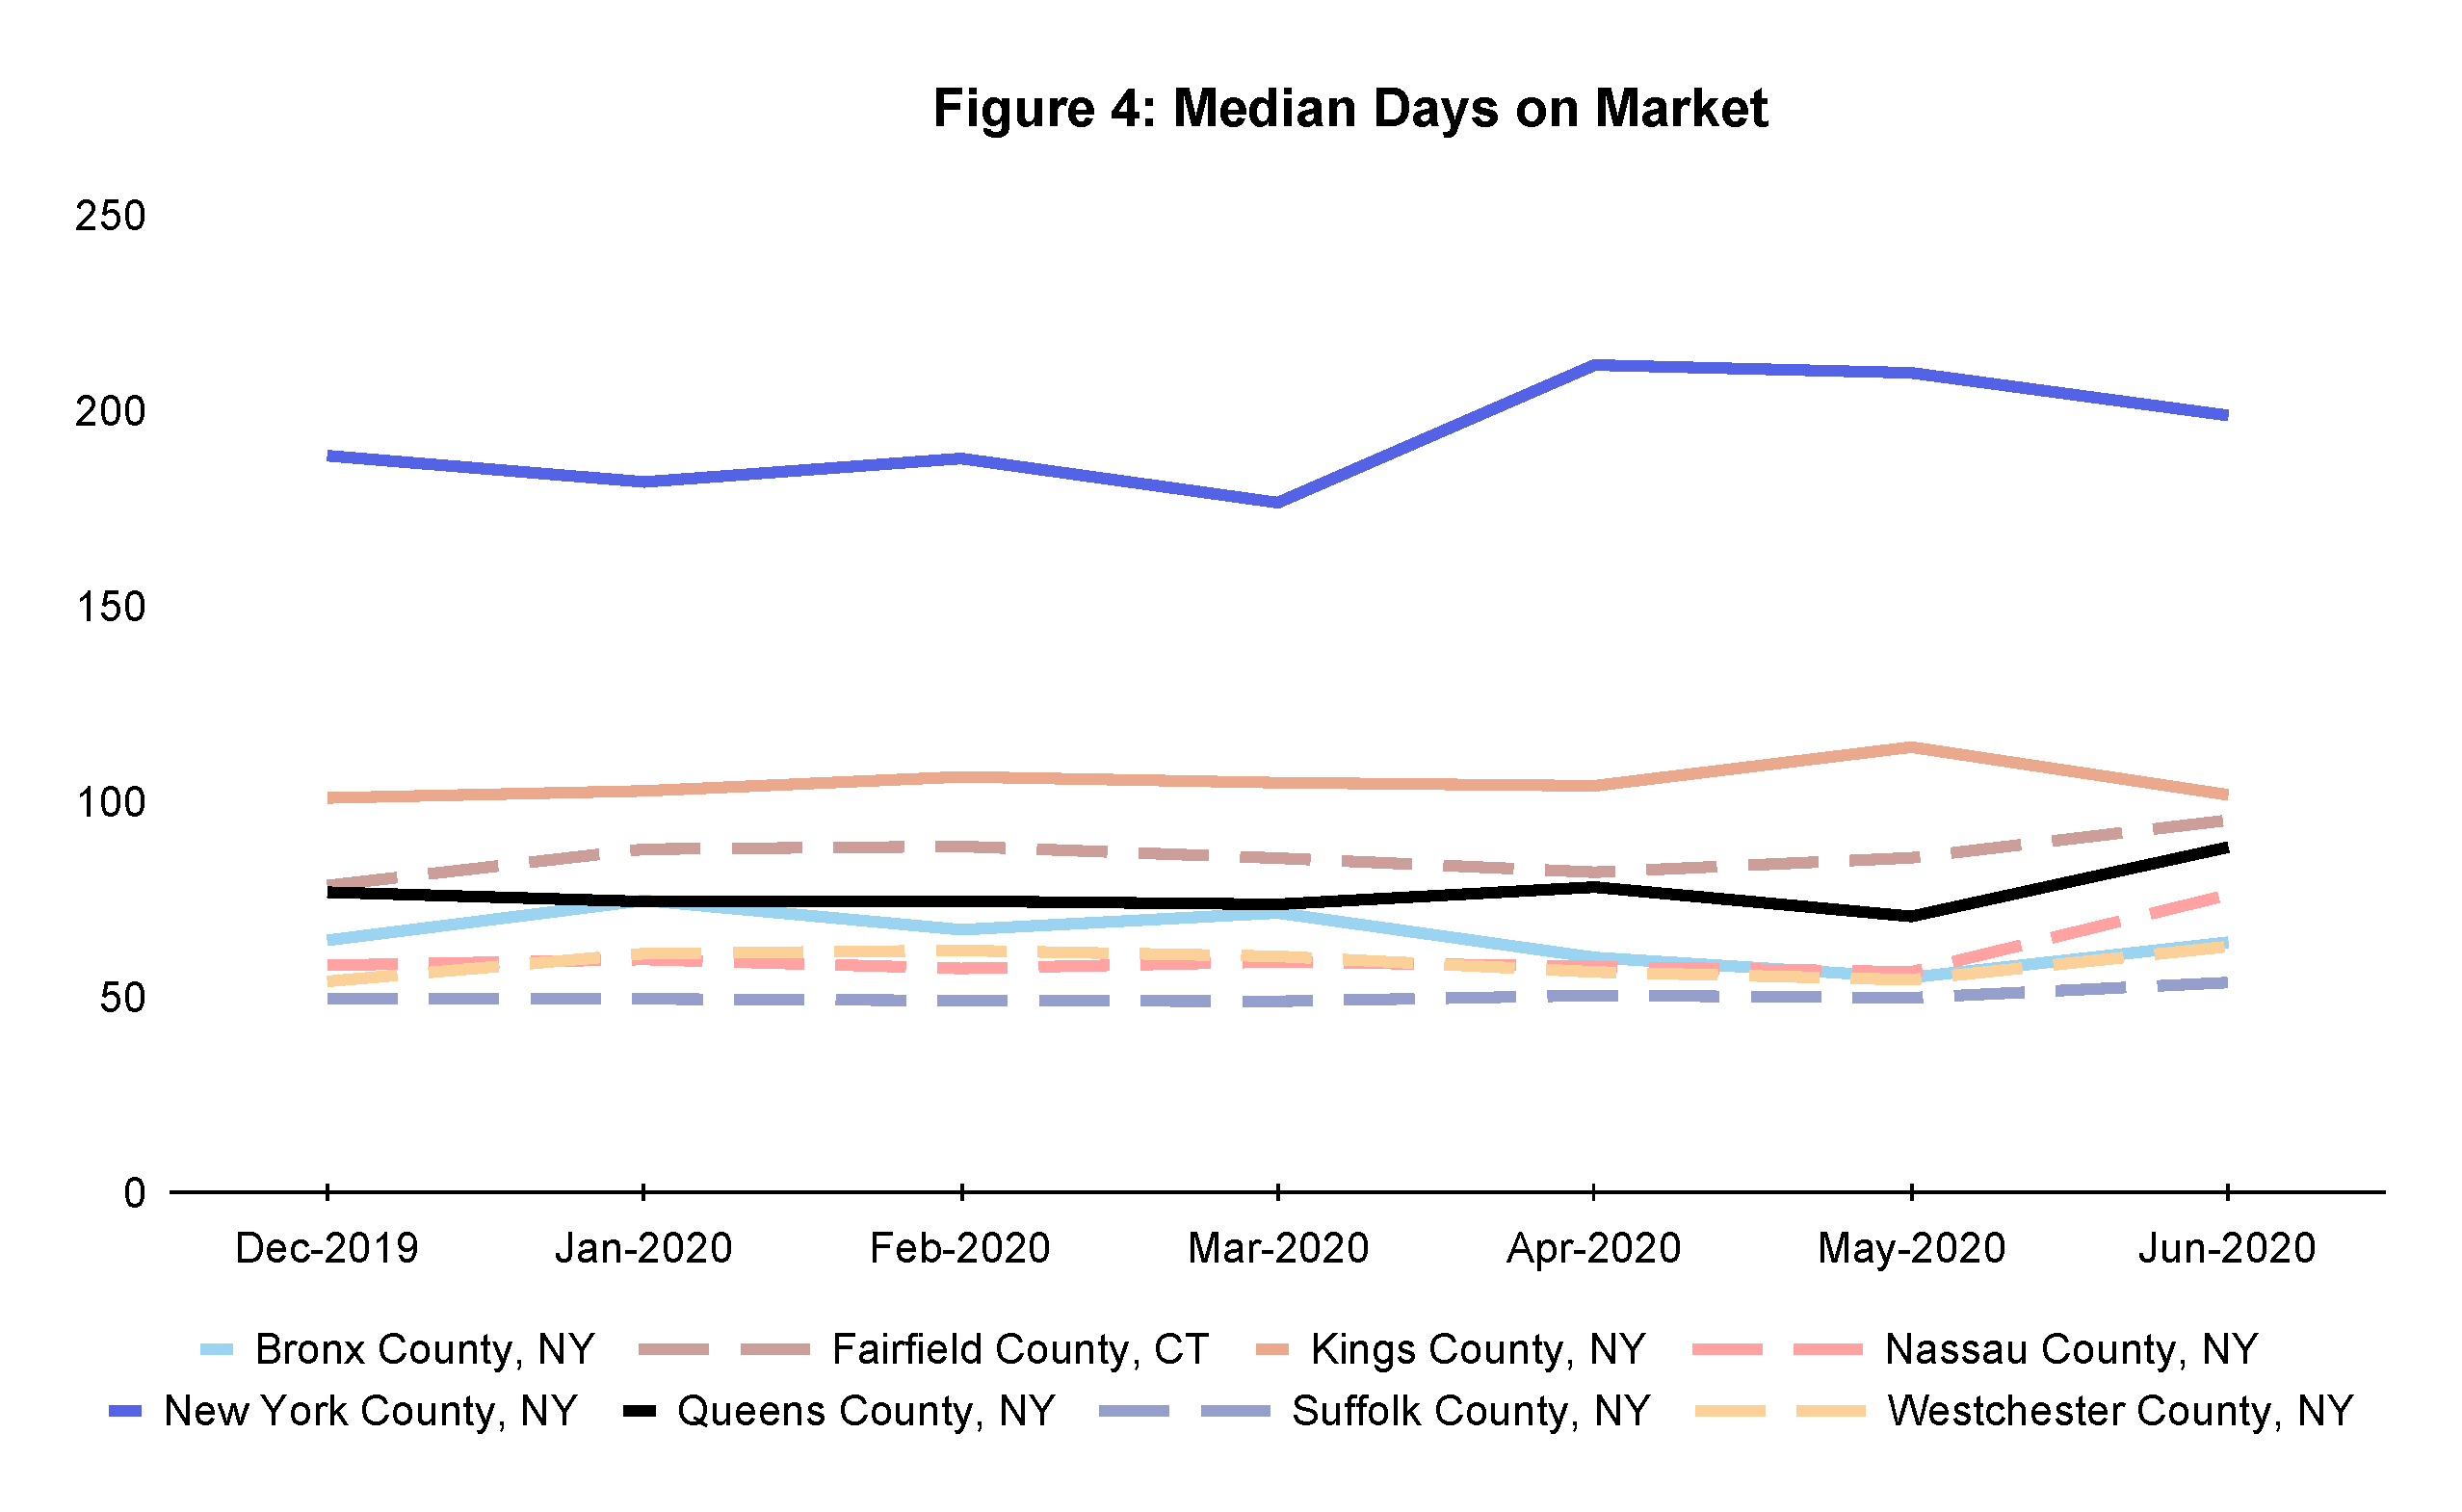
Echoing what we observed with Months of Supply, Manhattan properties take by far the longest time to sell with a median DOM of 199 days, while Brooklyn is a distant second at 102 days. COVID-19 has likely made selling even more difficult in these two urban markets with little urgency from buyers.
The Sale-to-List ratio is calculated as the sale price divided by the final listing price. This ratio helps buyers and sellers get a sense of how to negotiate on pricing. A high ratio suggests a sellers market, where bids exceed the asking price. Note that the ratio can also increase if sellers aggressively discount listing prices to entice bids.
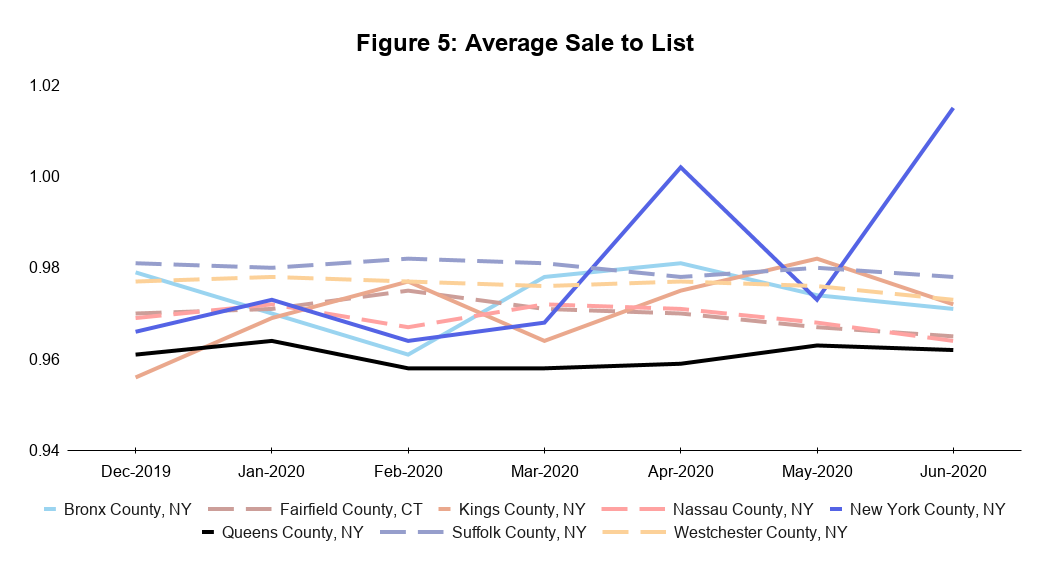
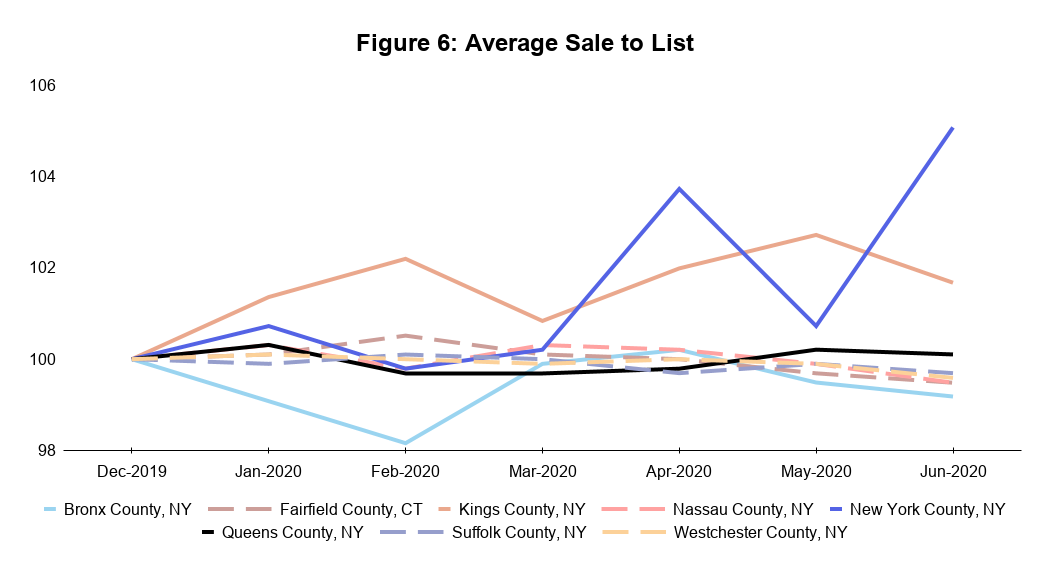
As shown by the dashed lines in Figure 5, the Sale-to-List ratio has so far been holding steady between 96-98% in 2020 for suburban markets, suggesting these markets are in equilibrium.
Manhattan and Brooklyn, on the other hand, actually saw transaction prices inch closer to seller expectations. Sellers in the two boroughs received 4% less than asking price (at 96% Sale-to-List) in December 2019. Since then, sellers in Manhattan are now receiving 1.5% over asking price (101.5% Sale-to-List), while Sale-to-List in Brooklyn rose from 95.6% to 97.2%. Since supply remains elevated in these markets and average time to sell has remained steady, we believe the increase in the Sale-to-List ratio is caused by desperate sellers dropping list prices to get the home to sell rather than a recovery in demand.
Market Condition Based on Key Metrics
 Takeaway
Our findings confirm that suburban housing markets are persevering better than their adjacent urban areas. This is corroborated by the price performance of the eight counties included in the analysis.
 Moving in with your aunt may make for good comedy, but it is not a viable long-term solution for most adults. As social-distancing and remote work increasingly become the everyday norm, we expect an increasing number of city-dwellers to start making their move to the suburbs permanent.
So which suburbs offer the best prospects for investors? While Kensington and Montauk are both considered suburbs of New York City, only one of them is an easy commute to Broadway, museums, fine-dining, consulates, and all the other world-class amenities offered by the Big Apple. We believe that while cities are currently out of favor, the entertainment, amenities and convenience that they offer will eventually be back in demand. Suburbs that are within a 1-hour commute from city centers should continue to see healthy demand and price action in the near-term. The stars are aligned for prized suburbs, as a new class of motivated buyers emerge seeking refuge from the city.
[1] "The Richest Neighborhoods Emptied Out Most as Coronavirus ...." 15 May. 2020, https://www.nytimes.com/interactive/2020/05/15/upshot/who-left-new-york-coronavirus.html. Accessed 6 Jul. 2020.
The content on this page provides general consumer information. It is not legal or financial advice. Unison has provided these links for your convenience, but does not endorse and is not responsible for the content, links, privacy policy, or security policy of the other websites.


